FXC - Real Trading Performance
I. TRADING APPROACH
FXC (or FXI - Continuous) is a modification of the FXI trading strategy, which trades automatically several (3-4) times a day. There is a special order placement procedure, which places the trades on negative slippage (i.e. with additional profit), or signals are recalculated and the basket trade is placed again. This increases the risk adjusted profitability (the Profit to Loss Ratio and Sharpe Ratio). Although the order placement generates some risk free profit, the price that we pay for it is taking the risk of trading the FXI strategy itself. Since it is virtually impossible to back test the FXC performance, the strategy has been traded for a while on the MT4 simulation trading platform before going live. More on the FXI strategy can be found on the FXI Strategy page.
II. PERFORMANCE SUMMARY
PAST PERFORMANCE IS NOT NECESSARILY INDICATIVE OF FUTURE RESULTS. THE RISK OF LOSS IN TRADING FOREX CAN BE SUBSTANTIAL. YOU SHOULD THEREFORE CAREFULLY CONSIDER WHETHER SUCH TRADING IS SUITABLE FOR YOU IN LIGHT OF YOUR FINANCIAL CONDITION AND INVESTMENT OBJECTIVES.
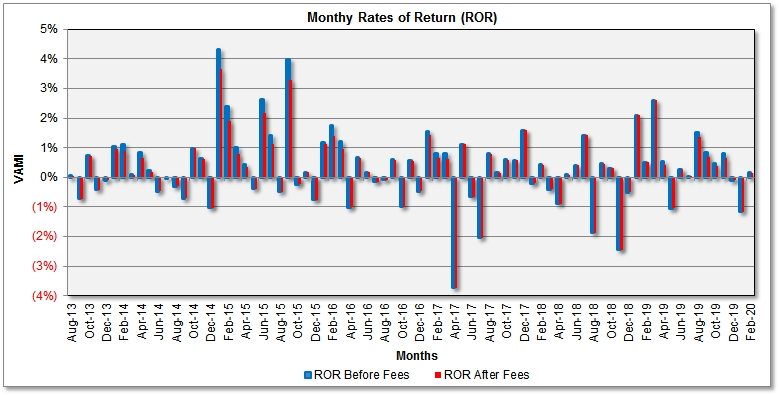
1. Monthly ROR and VAMI
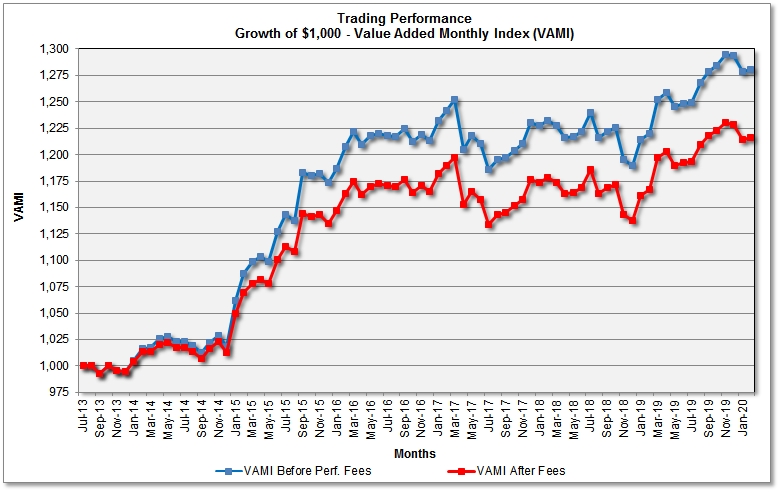
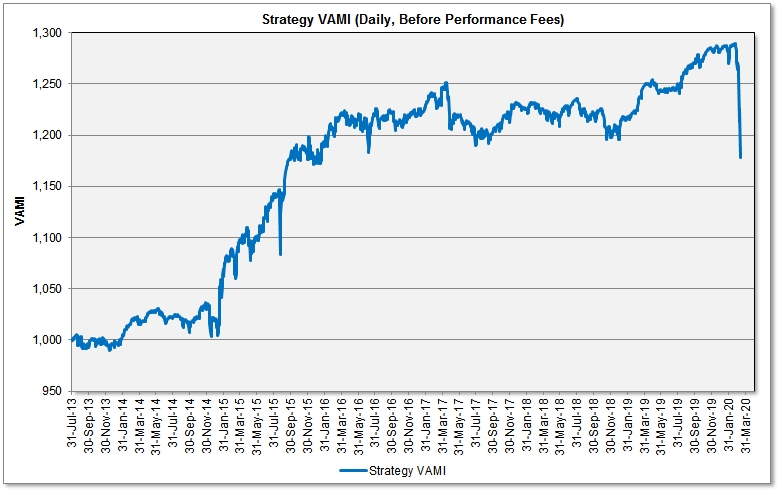
Daily VAMI Curve
Charts above show monthly rates of return (ROR) and the growth of $1,000 (the Value Added Monthly Index - VAMI), before and after 20% performance/incentive fee deduction. Compounding by monthly profit reinvesting is used.
2. Monthly Rates of Return (ROR), (Based on Real Trading)
|
|
Jan |
Feb |
Mar |
Apr |
May |
Jun |
Jul |
Aug |
Sep |
Oct |
Nov |
Dec |
YTD |
VAMI |
| 2013 | See simulated trading results of the current strategy | 0.05% 0.04%* | (0.74%) (0.74%)* | 0.72% 0.72%* | (0.42%) (0.42%)* | (0.10%) (0.10%)* | (0.39%) (0.40%)* | 995.0 994.9* | ||||||
| 2014 | 1.05% 0.95%* | 1.10% 0.88%* | 0.09% 0.07%* | 0.82% 0.66%* | 0.22% 0.18%* | (0.47%) (0.47%)* | (0.04%) (0.04%)* | (0.30%) (0.30%)* | (0.71%) (0.71%)* | 0.99% 0.99%* | 0.62% 0.60%* | (1.03%) (1.03%)* | 2.33% 1.76%* | 1,018.2 1,012.4* |
| 2015 | 4.32% 3.67%* | 2.39% 1.92%* | 1.00% 0.80%* | 0.43% 0.34%* | (0.39%) (0.39%)* | 2.61% 2.17%* | 1.41% 1.13%* | (0.49%) (0.49%)* | 3.97% 3.27%* | (0.23%) (0.23%)* | 0.17% 0.17%* | (0.76%) (0.76%)* | 15.22% 12.08%* | 1,173.2 1,134.8* |
| 2016 | 1.18% 1.11%* | 1.73% 1.39%* | 1.21% 0.97%* | (1.02%) (1.02%)* | 0.66% 0.66%* | 0.18% 0.18%* | (0.15%) (0.15%)* | (0.09%) (0.09%)* | 0.61% 0.57%* | (1.00%) (1.00%)* | 0.56% 0.56%* | (0.47%) (0.47%)* | 3.41% 2.71%* | 1,213.2 1,165.5* |
| 2017 | 1.56% 1.43%* | 0.82% 0.65%* | 0.79% 0.63%* | (3.74%) (3.74%)* | 1.11% 1.11%* | (0.66%) (0.66%)* | (2.04%) (2.04%)* | 0.80% 0.80%* | 0.15% 0.15%* | 0.58% 0.58%* | 0.57% 0.57%* | 1.58% 1.58%* | 1.37% 0.93%* | 1,229.9 1,176.3* |
| 2018 | (0.21%) (0.21%)* | 0.42% 0.42%* | (0.40%) (0.40%)* | (0.90%) (0.90%)* | 0.09% 0.09%* | 0.40% 0.40%* | 1.42% 1.42%* | (1.87%) (1.87%)* | 0.45% 0.45%* | 0.30% 0.30%* | (2.45%) (2.45%)* | (0.50%) (0.50%)* | (3.29%) (3.29%)* | 1,189.4 1,137.6* |
| 2019 | 2.09% 2.09%* | 0.50% 0.50%* | 2.60% 2.60%* | 0.53% 0.43%* | (1.05%) (1.05%)* | 0.25% 0.25%* | 0.02% 0.02%* | 1.52% 1.37%* | 0.85% 0.68%* | 0.47% 0.37%* | 0.79% 0.64%* | (0.10%) (0.10%)* | 8.76% 8.03%* | 1,293.6 1,228.9* |
| 2020 | (1.17%) (1.17%)* | 0.15% 0.15%* | (1.03%) (1.03%)* | 1,280.3 1,216.3* | ||||||||||
* - Net of 20% monthly performance fee
The above table shows actual trading results, before and after performance fees. Rates of return (ROR), net of 20% performance fee, are marked with asterisk (*). ROR figures have been calculated according to CFTC Regulation 4.35(a)(6)(F), by dividing the monthly net performance (gain or loss) by the nominal (notional) account size.
III. Performance Analytics (Based on Real Trading, Net of Performance Fees)
|
|
||||||||||||||||||||||||||||||||||||||||||||||||||||
Risk Disclaimer
THE RISK OF LOSS IN TRADING FOREIGN EXCHANGE (FOREX) CAN BE SUBSTANTIAL. YOU SHOULD THEREFORE CAREFULLY CONSIDER WHETHER SUCH TRADING IS SUITABLE FOR YOU IN LIGHT OF YOUR FINANCIAL CONDITION AND INVESTMENT OBJECTIVES. PAST PERFORMANCE IS NOT NECESSARILY INDICATIVE OF FUTURE RESULTS. THE PERFORMANCE QUOTED REPRESENTS PAST PERFORMANCE AND CURRENT PERFORMANCE MAY BE LOWER OR HIGHER. TRADING IN FOREIGN EXCHANGE IS SPECULATIVE AND MAY INVOLVE THE LOSS OF PRINCIPAL; THEREFORE, FUNDS PLACED UNDER MANAGEMENT SHOULD BE RISK CAPITAL FUNDS THAT IF LOST WILL NOT SIGNIFICANTLY AFFECT ONE'S PERSONAL WELL BEING. THIS IS NOT A SOLICITATION TO INVEST AND YOU SHOULD CAREFULLY CONSIDER YOUR FINANCIAL SITUATION PRIOR TO MAKING ANY INVESTMENT OR ENTERING INTO ANY TRANSACTION.