FX BASKET QUANT is our third portfolio trading strategy. The strategy
started live trading on January 1, 2013. The actual performance is tracked on the Performance page of our web site.
FX BASKET
QUANT
-
HYPOTHETICAL PERFORMANCE REPORT FROM STRATEGY BACK TESTING
PLEASE READ
FIRST DISCLAIMERS AT THE
BOTTOM OF THIS PAGE
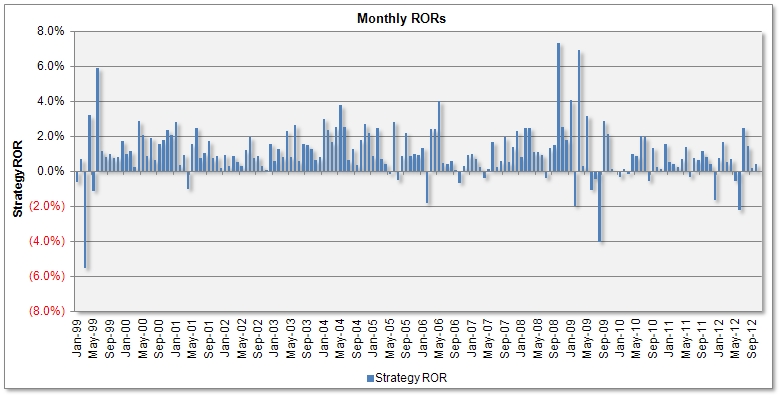
1. Monthly Rates
of Return (ROR), Before Performance Fees
Daily rates of return (ROR), from strategy
back testing, can be downloaded from this Excel spreadsheet.
Results are net of spreads and commissions and before performance
fees.
PAST
PERFORMANCE IS NOT NECESSARILY INDICATIVE OF FUTURE RESULTS.
2. Performance
Analytics - FX Basket Quant (Before Performance Fees)
Strategy Returns (Before
Performance Fees)
Testing
period
Jan 1999 - Dec 2012
Net profit on fixed capital
with / without monthly profit reinvesting
Average number of R/T transactions
(100k FX lots) per $1Million NAV per year
-
Average annual transaction costs -
bid/ask spreads (deduct from annual ROR)
2.5%
Average transaction bid/ask spread,
as a fraction of the transaction value
0.0002
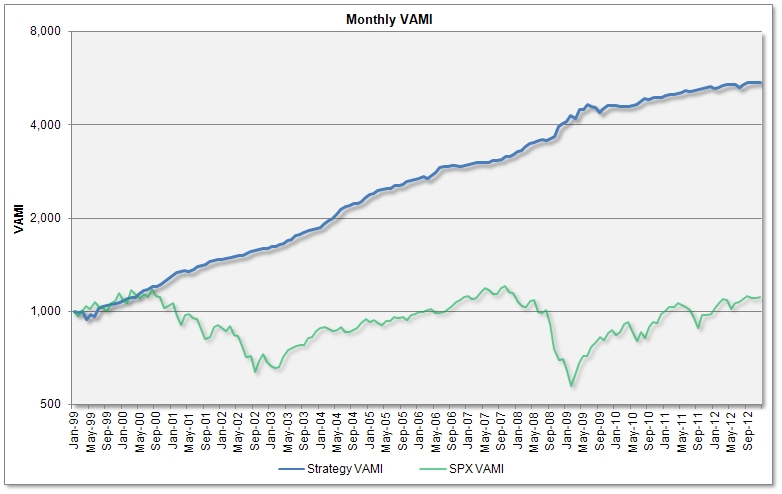
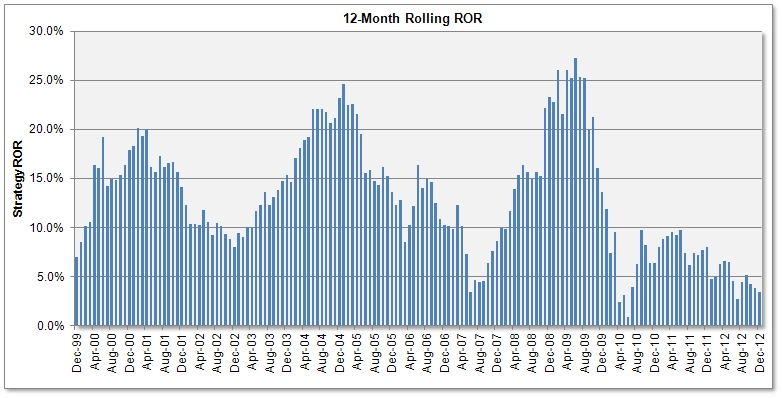
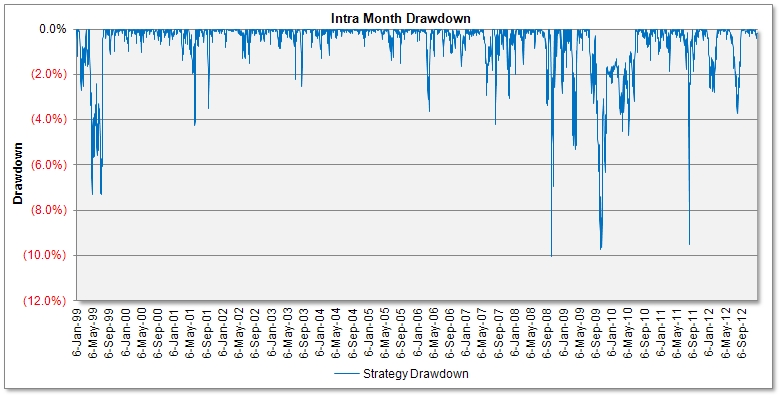
3. Performance Graphs and Histograms
3.1 Monthly Graphs
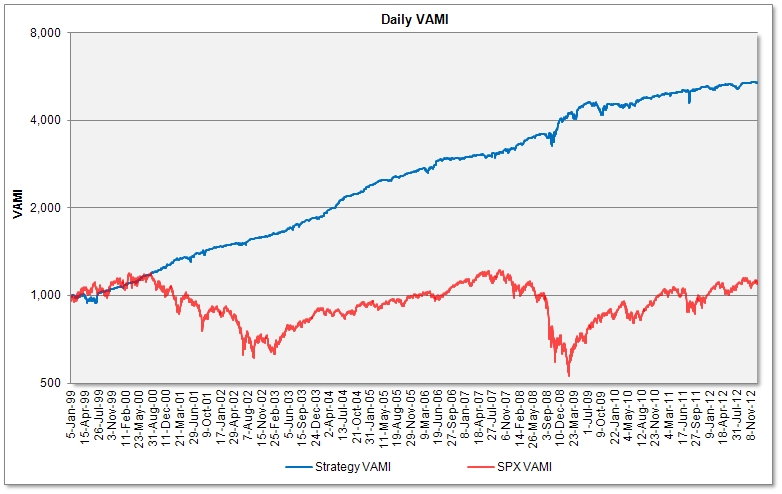
3.2. Daily Graphs
Better
results (smaller drawdown and better Sharpe and Sortino Ratio) can be
obtained by trading multiple trading strategies. The three currency trading
programs (FX Quant 11, FX Index Arb and FX Basket Quant) can be further
combined with our volatility
trading programs -
see this 6-strategy composite
back testing report.
HYPOTHETICAL OR
SIMULATED PERFORMANCE RESULTS HAVE CERTAIN INHERENT LIMITATIONS. UNLIKE AN
ACTUAL PERFORMANCE RECORD, SIMULATED RESULTS DO NOT REPRESENT ACTUAL TRADING.
ALSO, SINCE THE TRADES HAVE NOT ACTUALLY BEEN EXECUTED, THE RESULTS MAY HAVE
UNDER-OR-OVERCOMPENSATED FOR THE IMPACT, IF ANY, OF CERTAIN MARKET FACTORS, SUCH
AS LACK OF LIQUIDITY. SIMULATED TRADING PLATFORMS IN GENERAL ARE ALSO SUBJECT TO
THE FACT THAT THEY ARE DESIGNED WITH THE BENEFIT OF HINDSIGHT. NO REPRESENTATION
IS BEING MADE THAT ANY ACCOUNT WILL OR IS LIKELY TO ACHIEVE PROFITS OR LOSSES
SIMILAR TO THOSE SHOWN.
Risk Disclaimer
THE RISK OF
LOSS IN TRADING COMMODITIES CAN BE SUBSTANTIAL. YOU SHOULD THEREFORE CAREFULLY
CONSIDER WHETHER SUCH TRADING IS SUITABLE FOR YOU IN LIGHT OF YOUR FINANCIAL
CONDITION AND INVESTMENT OBJECTIVES. PAST PERFORMANCE IS NOT NECESSARILY
INDICATIVE OF FUTURE RESULTS. THE PERFORMANCE QUOTED REPRESENTS PAST PERFORMANCE
AND CURRENT PERFORMANCE MAY BE LOWER OR HIGHER. TRADING IN FOREIGN EXCHANGE IS
SPECULATIVE AND MAY INVOLVE THE LOSS OF PRINCIPAL; THEREFORE, FUNDS PLACED UNDER
MANAGEMENT SHOULD BE RISK CAPITAL FUNDS THAT IF LOST WILL NOT SIGNIFICANTLY
AFFECT ONE'S PERSONAL WELL BEING. THIS IS NOT A SOLICITATION TO INVEST AND YOU
SHOULD CAREFULLY CONSIDER YOUR FINANCIAL SITUATION PRIOR TO MAKING ANY
INVESTMENT OR ENTERING INTO ANY TRANSACTION. PLEASE SEE THE COMPLETE DISCLOSURE
DOCUMENT.