FX INDEX ARB > Actual Performance
I. TRADING APPROACH
FX INDEX ARB (FXIA) is a systematic, quantitative trading program, which trades currencies in the cash ("spot") markets. The strategy creates a complex portfolio of 10 global (G10) currencies and adjusts its components daily.
The strategy forms indexes of the 10 base currencies, which depend on the prices of the remaining 9 currencies against the selected index currency. It trades (counter trend, short volatility) the components of each index against the index itself (trend following, long volatility). Exactly the same rules are used for trend and counter trend trading. The point is to exploit the difference between the higher volatility of individual components and the lower volatility of indexes (as proven by the Modern Portfolio Theory). Based on positions of all components and indexes (a total of 90 currency crosses), positions are consolidated into the base 10 currencies, i.e. 9 currency pairs against the US Dollar. The resulting positions are then implemented in the market. The trading strategy is always in the market, but portfolio weights are adjusted daily.
Risk control is achieved through a variety of means which in most market conditions should minimize drawdowns. The first is portfolio construction and diversification (trend and counter trend trading in indexes and their components); second is portfolio concentration control through position size adjustment according to account size, volatility and risk-reward analysis (the position size limit for each currency is 0.8 of NAV); and third is a catastrophic stop based on money management rules (can be selected by the investor).
More on the FXIA strategy can be found on the FXIA Strategy page. You can read here about the trading strategy developer.
Beginning September 2012 on this page we will be tracking the actual performance of FX Index Arb - Currency Trading Program. To see extrapolation into the past of the currently traded strategy (ver. 06/2012), see the hypothetical performance report from strategy back testing.
II. PERFORMANCE SUMMARY
PAST PERFORMANCE IS NOT NECESSARILY INDICATIVE OF FUTURE RESULTS. THE RISK OF LOSS IN TRADING FOREX CAN BE SUBSTANTIAL. YOU SHOULD THEREFORE CAREFULLY CONSIDER WHETHER SUCH TRADING IS SUITABLE FOR YOU IN LIGHT OF YOUR FINANCIAL CONDITION AND INVESTMENT OBJECTIVES.
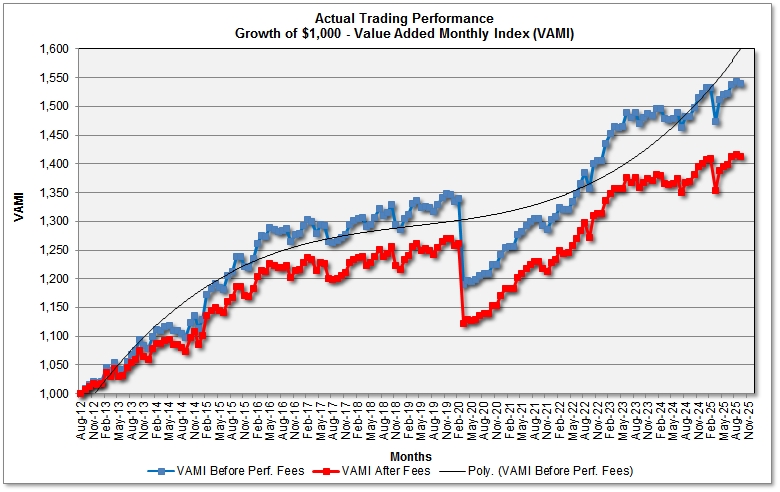
1. Monthly ROR and VAMI (Based on Real Trading, Before and After Performance Fees)
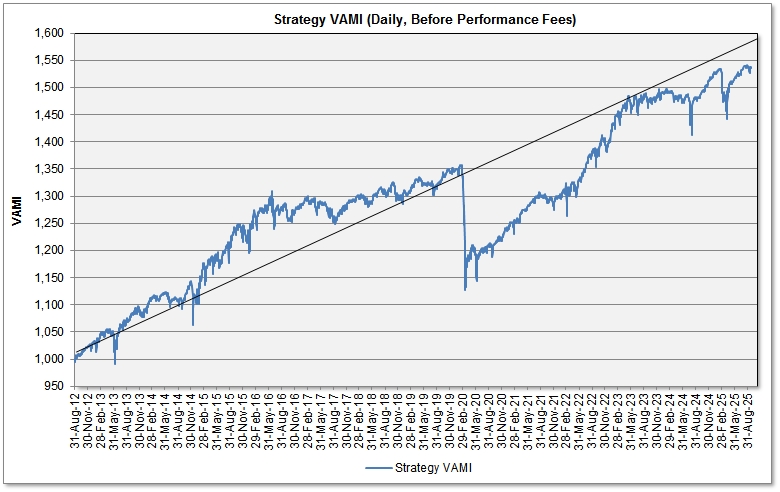
Daily VAMI Curve
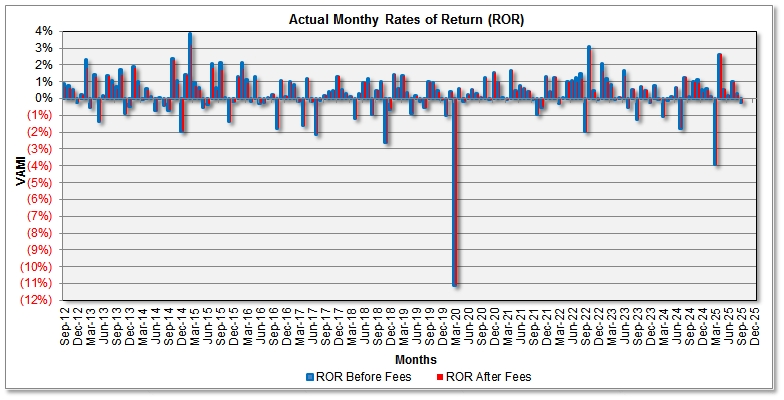
2. Monthly Rates of Return (ROR), Before/After Performance Fees (Based on Actual Trading)
|
|
Jan |
Feb |
Mar |
Apr |
May |
Jun |
Jul |
Aug |
Sep |
Oct |
Nov |
Dec |
YTD |
VAMI |
| 2012 | See back testing results of the currently traded strategy | 0.87% 0.70%* | 0.75% 0.60%* | 0.56% 0.45%* | (0.23%) (0.23%)* | 2.20% 1.76%* | 1,022.0 1,017.6* | |||||||
| 2013 | 0.23% 0.23%* | 2.30% 1.84%* | (0.56%) (0.56%)* | 1.44% 1.27%* | (1.35%) (1.35%)* | 0.19% 0.19%* | 1.34% 1.31%* | 1.10% 0.88%* | 0.72% 0.58%* | 1.73% 1.39%* | (0.91%) (0.91%)* | (0.45%) (0.45%)* | 5.86% 4.43%* | 1,079.4 1,060.2* |
| 2014 | 1.89% 1.79%* | 1.03% 0.83%* | (0.05%) (0.05%)* | 0.61% 0.50%* | 0.12% 0.10%* | (0.74%) (0.74%)* | 0.01% 0.01%* | (0.44%) (0.44%)* | (0.68%) (0.68%)* | 2.37% 2.27%* | 1.06% 0.84%* | (1.95%) (1.95%)* | 3.18% 2.42%* | 1,113.7 1,085.8* |
| 2015 | 1.40% 1.40%* | 3.84% 3.19%* | 0.95% 0.76%* | 0.63% 0.51%* | (0.54%) (0.54%)* | (0.33%) (0.33%)* | 2.05% 1.82%* | 0.64% 0.51%* | 2.13% 1.71%* | 0.01% 0.01%* | (1.38%) (1.38%)* | (0.20%) (0.20%)* | 9.46% 7.59%* | 1,219.1 1,168.3* |
| 2016 | 1.30% 1.30%* | 2.12% 1.76%* | 1.14% 0.91%* | (0.18%) (0.18%)* | 1.31% 1.09%* | (0.28%) (0.28%)* | (0.26%) (0.26%)* | 0.07% 0.07%* | 0.25% 0.25%* | (1.76%) (1.76%)* | 1.08% 1.08%* | 0.12% 0.12%* | 4.94% 4.10%* | 1,279.3 1,216.2* |
| 2017 | 1.02% 0.98%* | 0.82% 0.66%* | (0.21%) (0.21%) | (1.61%) (1.61%)* | 1.19% 1.19%* | (0.18%) (0.18%)* | (2.12%) (2.12%)* | (0.11%) (0.11%)* | 0.19% 0.19%* | 0.41% 0.41%* | 0.48% 0.48%* | 1.32% 1.32%* | 1.14% 0.93%* | 1,293.9 1,227.6* |
| 2018 | 0.53% 0.53%* | 0.29% 0.26%* | 0.15% 0.12%* | (1.22%) (1.22%)* | 0.30% 0.30%* | 0.96% 0.96%* | 1.17% 0.93%* | (0.97%) (0.97%)* | 0.49% 0.49%* | 1.04% 0.93%* | (2.63%) (2.63%)* | (0.64%) (0.64%)* | (0.59%) (0.99%)* | 1,286.3 1,215.5* |
| 2019 | 1.43% 1.43%* | 0.61% 0.61%* | 1.35% 1.34%* | 0.37% 0.30%* | (0.87%) (0.87%)* | 0.17% 0.17%* | (0.17%) (0.17%)* | (0.56%) (0.56%)* | 0.98% 0.98%* | 0.93% 0.83%* | 0.47% 0.37%* | (0.05%) (0.05%)* | 4.73% 4.45%* | 1,347.1 1,269.6* |
| 2020 | (0.98%) (0.98%)* | 0.39% 0.39%* | (11.09%) (11.09%)* | 0.61% 0.61%* | (0.16%) (0.16%)* | 0.23% 0.23%* | 0.55% 0.55%* | 0.27% 0.27%* | 0.08% 0.08%* | 1.23% 1.23%* | (0.02%) (0.02%)* | 1.54% 1.54%* | (7.74%) (7.74%)* | 1,242.8 1,171.2* |
| 2021 | 0.98% 0.98%* | 0.05% 0.05%* | (0.01%) (0.01%)* | 1.67% 1.67%* | 0.47% 0.47%* | 0.75% 0.75%* | 0.60% 0.60%* | 0.44% 0.44%* | (0.03%) (0.03%)* | (0.95%) (0.95%)* | (0.51%) (0.51%)* | 1.30% 1.30%* | 4.82% 4.82%* | 1,302.7 1,227.6* |
| 2022 | 0.45% 0.45%* | 1.25% 1.25%* | (0.30%) (0.30%)* | 0.02% 0.02%* | 1.00% 1.00%* | 1.05% 1.04%* | 1.26% 1.01%* | 1.47% 1.18%* | (1.99%) (1.99%)* | 3.10% 2.89%* | 0.49% 0.39%* | (0.03%) (0.03%)* | 7.95% 7.04%* | 1,406.3 1,314.0* |
| 2023 | 2.07% 1.66%* | 1.19% 0.95%* | 0.83% 0.66%* | (0.07%) (0.07%)* | 0.08% 0.08%* | 1.65% 1.32%* | (0.54%) (0.54%)* | 0.55% 0.54%* | (1.25%) (1.25%)* | 0.72% 0.72%* | 0.50% 0.50%* | (0.25%) (0.25%)* | 5.56% 4.38%* | 1,484.5 1,371.5* |
| 2024 | 0.79% 0.69%* | (0.03%) (0.03%)* | (1.10%) (1.10%)* | (0.09%) (0.09%)* | 0.10% 0.10%* | 0.68% 0.68%* | (1.76%) (1.76%)* | 1.26% 1.26%* | 0.11% 0.11%* | 0.99% 0.96%* | 1.14% 0.91%* | 2.05% 1.70%* | 1,515.0 1,394.8* | |
* - Net of 20% monthly performance fee
The above table shows actual trading results, before and after performance fees. Rates of return (ROR), net of 20% performance fee, are marked by asterisk (*). ROR figures have been calculated according to CFTC Regulation 4.35(a)(6)(i)(F), by dividing the monthly net performance (gain or loss) by the nominal (notional) account size.
The charts below show monthly rates of return (ROR) and the growth of $1,000 (the Value Added Monthly Index - VAMI), before and after 20% performance/incentive fee deduction. Compounding by monthly profit reinvesting is used.
III. Performance Analytics (Based on Actual Trading Results, Net of 20% Performance Fee)
|
|
||||||||||||||||||||||||||||||||||||||||||||||||||||
Risk Disclaimer
THE RISK OF LOSS IN TRADING FOREIGN EXCHANGE (FOREX) CAN BE SUBSTANTIAL. YOU SHOULD THEREFORE CAREFULLY CONSIDER WHETHER SUCH TRADING IS SUITABLE FOR YOU IN LIGHT OF YOUR FINANCIAL CONDITION AND INVESTMENT OBJECTIVES. PAST PERFORMANCE IS NOT NECESSARILY INDICATIVE OF FUTURE RESULTS. THE PERFORMANCE QUOTED REPRESENTS PAST PERFORMANCE AND CURRENT PERFORMANCE MAY BE LOWER OR HIGHER. TRADING IN FOREIGN EXCHANGE IS SPECULATIVE AND MAY INVOLVE THE LOSS OF PRINCIPAL; THEREFORE, FUNDS PLACED UNDER MANAGEMENT SHOULD BE RISK CAPITAL FUNDS THAT IF LOST WILL NOT SIGNIFICANTLY AFFECT ONE'S PERSONAL WELL BEING. THIS IS NOT A SOLICITATION TO INVEST AND YOU SHOULD CAREFULLY CONSIDER YOUR FINANCIAL SITUATION PRIOR TO MAKING ANY INVESTMENT OR ENTERING INTO ANY TRANSACTION. PLEASE SEE THE COMPLETE FXIA DISCLOSURE DOCUMENT.
![]() BACK TO THE MAIN PERFORMANCE PAGE
BACK TO THE MAIN PERFORMANCE PAGE