Multi Strategy - Real Trading Results
Below are given actual trading results from combined trading of multiple strategies. Multi-strategy trading started with 3 strategies in March 2012. Beginning February 2014, seven strategies are trading simultaneously. To see back testing results of the most current modifications of these strategies, please see the MS7-BackTesting page. Actual trading results presented below are achieved trading former versions of the strategies.
By retaining the returns of the replaced (less efficient) strategies we avoid the "survivorship bias". The combined performance reflects the performance of the good strategies, as well as performance of the failed and replaced strategies.
I. ACTUAL TRADING RESULTS
PAST PERFORMANCE IS NOT NECESSARILY INDICATIVE OF FUTURE RESULTS. THE RISK OF LOSS IN TRADING EQUITIES CAN BE SUBSTANTIAL. YOU SHOULD THEREFORE CAREFULLY CONSIDER WHETHER SUCH TRADING IS SUITABLE FOR YOU IN LIGHT OF YOUR FINANCIAL CONDITION AND INVESTMENT OBJECTIVES.
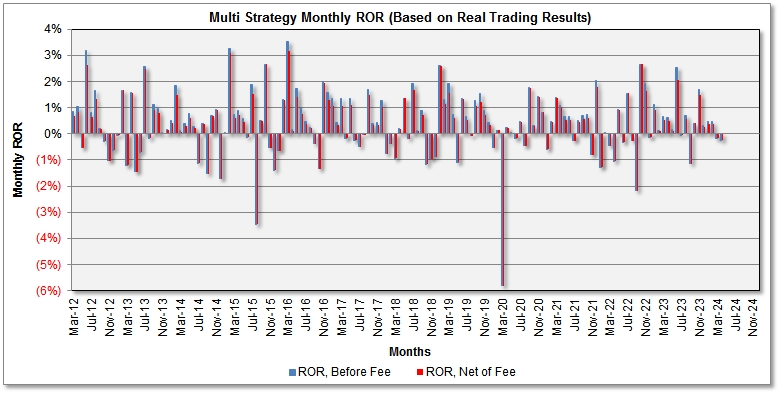
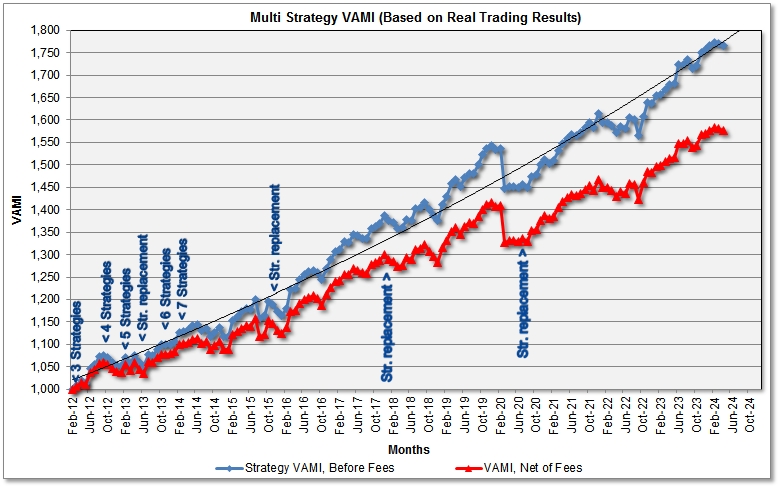
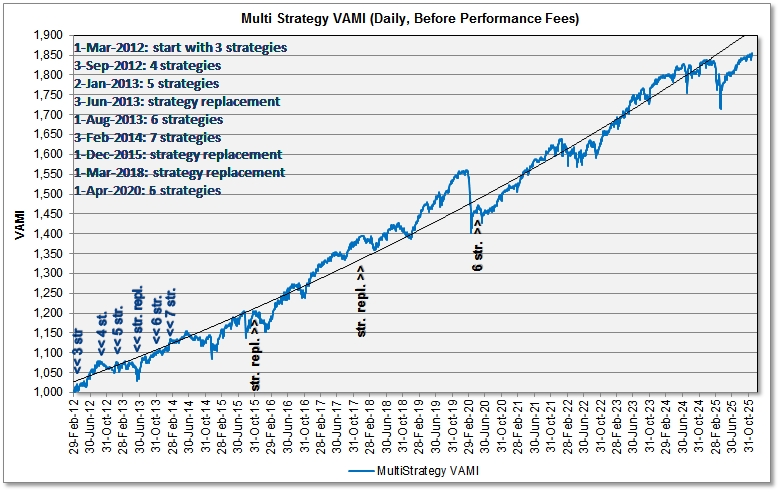
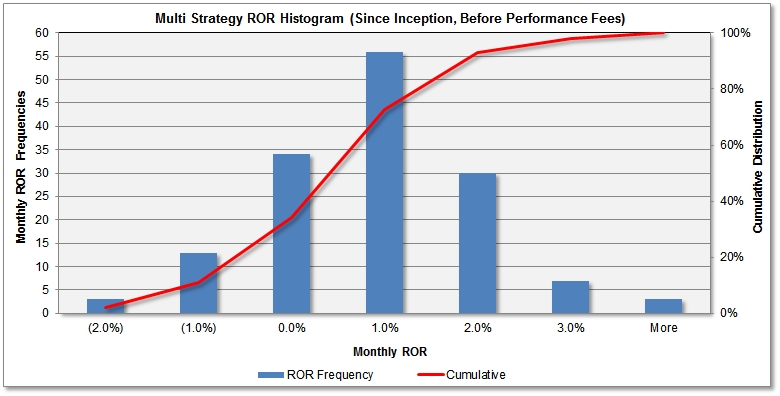
1a. Monthly Rates of Return (ROR) and VAMI Charts
1b. Monthly Rates of Return (Based on Real Trading)
|
|
Jan |
Feb |
Mar |
Apr |
May |
Jun |
Jul |
Aug |
Sep |
Oct |
Nov |
Dec |
YTD |
VAMI |
|
2011 |
See back testing results of a 7 strategies portfolio | - | 1,000.0 | |||||||||||
|
2012 |
- | - | 0.84% 0.67%* | 1.06% 0.85%* | (0.54%) (0.54%)* | 3.17% 2.65%* | 0.83% 0.66%* | 1.67% 1.34%* | 0.21% 0.17%* | (0.28%) (0.28%)* | (1.03%) (1.03%)* | (0.62%)(0.62%)* | 5.33% 3.87%* | 1,053.3 1,038.7* |
|
2013 |
(0.06%) (0.06%)* | 1.66% 1.66%* | (1.20%) (1.20%)* | 1.56% 1.56%* | (1.46%) (1.46%)* | (0.71%) (0.71%)* | 2.57% 2.50%* | (0.16%) (0.16%)* | 1.11% 0.92%* | 0.98% 0.78%* | 0.01% 0.01%* | 0.17% 0.13%* | 4.47% 3.97%* | 1,100.7 1,079.9* |
|
2014 |
0.52% 0.42%* | 1.86% 1.49%* | 0.11% 0.09%* | 0.39% 0.32%* | 0.76% 0.61%* | 0.26% 0.21%* | (1.13%) (1.13%)* | 0.39% 0.39%* | (1.53%) (1.53%)* | 0.68% 0.68%* | 0.93% 0.93%* | (1.71%) (0.71%)* | 1.49% 0.71%* | 1,117.1 1,087.6* |
|
2015 |
0.02% 0.02%* | 3.27% 3.10%* | 0.73% 0.59%* | 0.89% 0.71%* | 0.58% 0.46%* | (0.14%) (0.14%)* | 1.89% 1.54%* | (3.46%) (3.46%)* | 0.49% 0.49%* | 2.67% 2.67%* | (0.53%) (0.53%)* | (1.39%) (1.39%)* | 4.96% 3.98%* | 1,172.5 1,130.9* |
|
2016 |
(0.65%) (0.65%)* | 1.30% 1.30%* | 3.52% 3.16%* | 0.15% 0.12%* | 1.75% 1.40%* | 0.95% 0.76%* | 0.46% 0.37%* | 0.26% 0.21%* | (0.40%) (0.40%)* | (1.34%) (1.34%)* | 2.04% 1.98%* | 1.60% 1.28%* | 9.95% 8.40%* | 1,289.2 1,225.9* |
|
2017 |
1.34% 1.07%* | 0.45% 0.36%* | 1.31% 1.05%* | (0.20%) (0.20%)* | 1.38% 1.14%* | (0.25%) (0.25%)* | (0.54%) (0.54%)* | (0.05%) (0.05%)* | 1.71% 1.54%* | 0.42% 0.33% | 0.46% 0.37%* | 1.30% 1.04%* | 7.55% 6.00%* | 1,386.5 1,299.4* |
|
2018 |
(0.75%) (0.75%)* | (0.37%) (0.37%)* | (0.93%) (0.93%)* | 0.16% 0.16%* | 1.37% 1.37%* | (0.17%) (0.17%)* | 1.92% 1.68%* | 0.12% 0.10%* | 0.91% 0.73%* | (1.16%) (1.16%)* | (0.95%) (0.95%)* | (0.88%) (0.88%)* | (0.81%) (1.24%)* | 1,375.3 1,283.3* |
|
2019 |
2.60% 2.60%* | 1.33% 1.15%* | 1.94% 1.55%* | 0.73% 0.59%* | (1.09%) (1.09%)* | 1.37% 1.32%* | 0.62% 0.50%* | (0.07%) (0.07%)* | 1.36% 1.10%* | 1.55% 1.24% | 0.90% 0.72%* | 0.45% 0.36%* | 12.27% 10.37%* | 1,544.0 1,416.4* |
|
2020 |
(0.56%) (0.56%)* | 0.14% 0.14%* | (5.81%) (5.81%)* | 0.23% 0.23%* | 0.04% 0.04%* | (0.18%) (0.18%)* | 0.47% 0.47%* | (0.46%) (0.46%)* | 1.76% 1.76%* | 0.30% 0.30%* | 1.43% 1.43%* | 0.83% 0.83%* | (1.99%) (1.99%)* | 1,512.3 1,387.6* |
|
2021 |
(0.58%) (0.58%)* | 0.46% 0.46%* | 1.38% 1.38%* | 1.09% 1.02%* | 0.65% 0.52%* | 0.68% 0.54%* | (0.27%) (0.27%)* | 0.53% 0.50%* | 0.70% 0.56%* | 0.75% 0.60%* | (0.79%) (0.79%)* | 2.05% 1.80%* | 6.78% 5.82%* | 1,614.9 1,468.3* |
|
2022 |
(1.28%) (1.28%)* | 0.04% 0.04%* | (0.45%) (0.45%)* | (1.04%) (1.04%)* | 0.92% 0.92% | (0.33%) (0.33%)* | 1.56% 1.56%* | (0.27%) (0.27%)* | (2.18%) (2.18%)* | 2.67% 2.67%* | 1.93% 1.64%* | (0.12%) (0.12%)* | 3.42% 2.87%* | 1,636.4 1,483.6* |
|
2023 |
1.12% 0.92%* | 0.15% 0.12%* | 0.66% 0.53%* | 0.63% 0.51%* | 0.15% 0.12%* | 2.56% 2.04%* | (0.05%) (0.05%)* | 0.70% 0.57%* | (1.14%) (1.14%)* | 0.40% 0.40%* | 1.68% 1.50%* | 0.32% 0.25%* | 7.36% 5.88%* | 1,722.3 1,543.8* |
|
2024 |
0.48% 0.39%* | 0.46% 0.37% | (0.17%) (0.17%)* | (0.24%) (0.24%)* | 1.18% 1.02%* | 0.47% 0.38%* | (0.87%)* (0.87%)* | 0.87% 0.87%* | (0.38%) (0.38%)* | (0.41%) (0.41%)* | 1.99% 1.75%* | (0.41%) (0.41%)* | 2.99% 2.30%* | 1,809.3 1,607.0* |
* - Net of 20% performance fee on new net profit (above high water mark)
Portfolio composition:
I. Mar/01/2012 - Aug/31/2012: 33.3% FX Quant 11 (FXQ), 33.3% Euro Fast Trend (EFT), 33.3% V1 (initial portfolio composition)
II. Sep/01/2012 - Jan/31/2013: 25% FXQ, 25% FX Index Arb (FXIA), 25% EFT, 25% V1 (FXIA added)
III. Feb/01/2013 - May/31/2013: 20% FXQ, 20% FXIA, 20% FX Basket Quant (FXBQ), 20% EFT, 20% V1 (FXBQ added)
IV. Jun/01/2013 - Jul/31/2013: 20% FXQ, 20% FXIA, 20% FXBQ, 20% V4, 20% V1 (EFT replaced with V4)
V. Aug/01/2013 - Jan/31/2014: 16.67% FXQ, 16.67% FXIA, 16.67% FXBQ, 16.67% FXC, 16.67% V4, 16.67% V1 (FXC added)
VI. Feb/01/2014 - Nov/31/2015: 14.29% FXQ, 14.29% FXIA, 14.29% FXBQ, 14.29% FXC, 14.29% V1, 14.29% V2 (old), 14.29% V4 (V2 added)
VII. Dec/01/2015 - Feb/28/2018: 14.29% FXQ, 14.29% FXIA, 14.29% FXBQ, 14.29% FXC, 14.29% V1, 14.29% V2 (new), 14.29% V4 (V2 redesigned)
VIII. Mar/01/2018 - April/30/2020: 14.29% FXQ, 14.29% FXIA, 14.29% FXBQ, 14.29% FXC, 14.29% V1, 14.29% SP Quant, 14.29% V4 (V2 replaced by SP Quant)
IX. May/01/2020 forward: 16.67% FXQ, 16.67% FXIA, 16.67% FXBQ, 16.67% V1, 16.67 SP Quant-2, 16.67% V4 (FXC removed, SP Quant modified)
Portfolio trading is overleveraged by 20% over individual strategies (to take advantage of reduced volatility of portfolio trading). These strategies are trading real capital, but in separate accounts (individual strategies do not trade equal capital). The combined performance is calculated by combining returns from all strategies (equally weighted), using the following formula (from February 1, 2014 forward):
![]()
![]()
Combined daily and monthly rates of return from real trading, as well as performance analytics, can be downloaded from this link (Excel spreadsheet, 4 Mb).
II. PERFORMANCE STATISTICS
(Based on Real Trading Results, Net of 20% Performance Fees)
|
|
||||||||||||||||||||||||||||||||||||||||||||||||||||
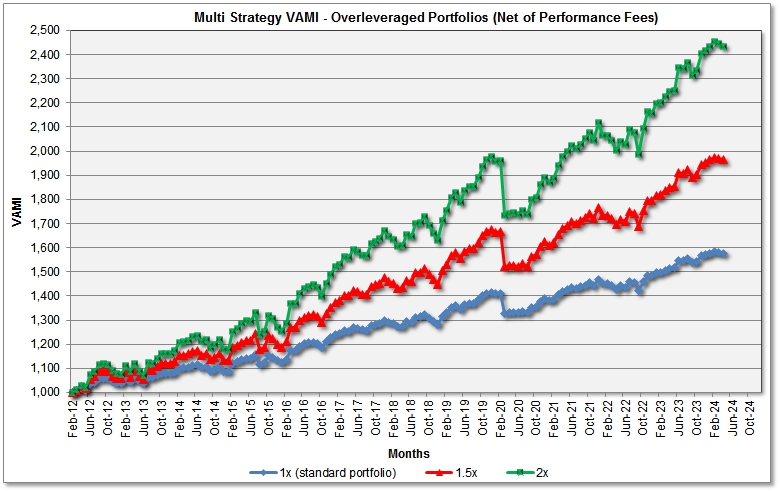
III. Nonstandard (Overleveraged) Portfolios
All returns and performance analytics discussed above are achieved in a "nominally leveraged" or "1x" multi-strategy portfolio. The 1x portfolio is quite conservative and even the most prudent investors will consider the risks reasonable. A client with higher risk tolerance, looking for higher returns, can assign (in the Monthly Allocation Order) a Nominal Account Size (or "Designated Trading Size") in excess of his account balance. Such notionally funded accounts (1.5x, 2x etc.) would have all return and risk characteristics increased by a factor of 1.5, 2.0 etc. Simply said, the 2x program would grow twice as fast as the 1x program, but also the 2x program drawdowns would be twice as large as the 1x program drawdown. Remember: any target return can be achieved by use of leverage; think of target risk (drawdown) when selecting the appropriate leverage.
Composite Performance Disclaimer
THIS COMPOSITE PERFORMANCE REPORT IS HYPOTHETICAL AND THESE TRADING ADVISORS HAVE NOT TRADED TOGETHER IN THE MANNER SHOWN IN THE COMPOSITE. HYPOTHETICAL PERFORMANCE RESULTS HAVE MANY INHERENT LIMITATIONS, SOME OF WHICH ARE DESCRIBED BELOW. NO REPRESENTATION IS BEING MADE THAT ANY MULTI-ADVISOR MANAGED ACCOUNT OR POOL WILL OR IS LIKELY TO ACHIEVE A COMPOSITE PERFORMANCE RECORD SIMILAR TO THAT SHOWN. IN FACT, THERE ARE FREQUENTLY SHARP DIFFERENCES BETWEEN A HYPOTHETICAL COMPOSITE PERFORMANCE RECORD AND THE ACTUAL RECORD SUBSEQUENTLY ACHIEVED.