7 Strategies Combined - Back Testing Results
Below is given an optimal portfolio construction based on FX Quant 11, FX Index Arb, FX Basket Quant, FXC, V1, V2 and V4 back testing data. For actual multi strategy trading results, please see MS-Real (in real trading former versions of these strategies were used).
I. MODERN PORTFOLIO THEORY - SHARPE RATIO MAXIMIZATION
Risk-adjusted returns (Sharpe Ratio) are significantly improved by strategy diversification, i.e. combining the FX Quant 11, FX Index Arb, FX Basket Quant, FXC, V1, V2 and V4 .
According to the Modern Portfolio Theory (MPT), by combining trading strategies in a multi-strategy portfolio, better returns can be achieved for the given risk (or, the same return can be achieved at lower risk). Open this Excel spreadsheet (3.6 MB) and click on the Sharpe Ratio (monthly) tab to see optimal portfolio construction based on the Modern Portfolio Theory. Monthly ROR correlations are used for optimal portfolio construction.
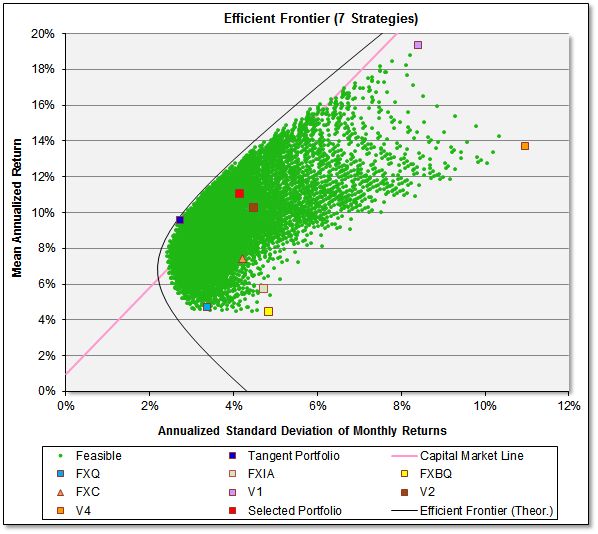
The portfolio on the efficient frontier with the highest Sharpe Ratio is known as the Tangent (Market) Portfolio (see the dark blue colored square in above diagram), or sometimes the super-efficient portfolio; it is the tangency-portfolio in the above diagram. The optimal (market) portfolio would have the following strategy allocation: FX Quant 11 (30%), FXIA (0%), FX Basket Quant (0%), FXC (30%), V1 (20%), V2 (20%), V4 (0%). However, given the excellent performance of all stand-alone strategies, we decided to use the equally weighted portfolio composition (14.29% each strategy). By trading equally weighted portfolio, we also avoid over-optimization (curve-fitting) problems.
When the market portfolio is combined with the risk-free asset, the result is the Capital Market Line (CML). All points along the CML have superior risk-return profiles to any portfolio on the efficient frontier. Just the special case of the market portfolio with zero cash weighting is on the efficient frontier. Additions of cash (risk-free asset) or leverage (cash lending) in combination with the market portfolio are on the Capital Market Line. All of these portfolios represent the highest possible Sharpe Ratio.
The Selected Portfolio (the red colored square in the above diagram) is over-leveraged by 20%, above the non-leveraged equally weighted portfolio (not shown on the chart). The end result is that the combined portfolio has a higher Sharpe Ratio (better risk-adjusted return) than Sharpe Ratio of any individual strategie.
To learn more on MPT, read this excellent Introduction to Investment Theory by William N. Goetzmann of Yale School of Management.
II. RATES OF RETURN (ROR) AND VAMI OF DIVESRIFIED PORTFOLIO (BACK TESTING RESULTS)
Below are given the hypothetical composite equity (VAMI) curves and ROR distributions of the FX Quant 11, FX Index Arb, FX Basket Quant, FXC, V1, V2 and V4 programs combined. They are solely given as an illustration of trading program combined performance.
In order not to fall into the trap of over-optimization (by selecting the optimal portfolio, according to the MPT), we selected an equally weighted strategy portfolio (14.286% each strategy). Also, the equally weighted portfolio is least sensitive to portfolio composition selection. To take advantage of diversification and decreased drawdowns, the combined strategy will trade at 20% increased leverage. See the calculations by clicking the RORs tab in this Excel spreadsheet. You can see how performance changes by changing portfolio component weight coefficients in that spreadsheet.
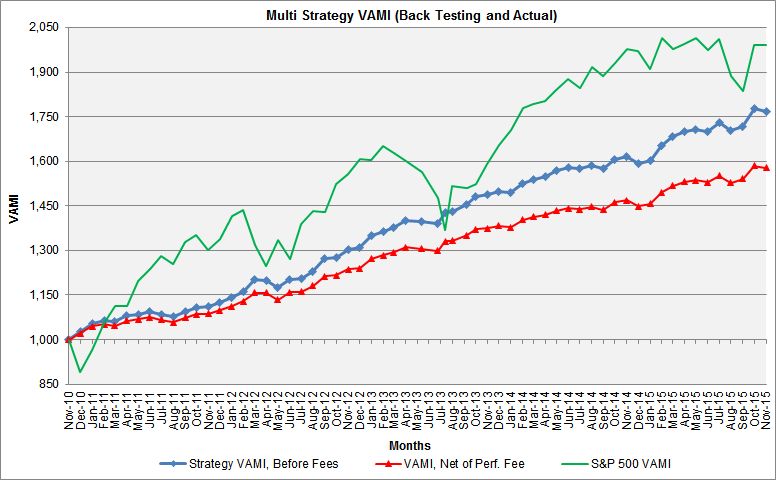
Fig. 1 - Combined Portfolio - Monthly VAMI (16.67% each of the 7 strategies, 20% overleveraged)
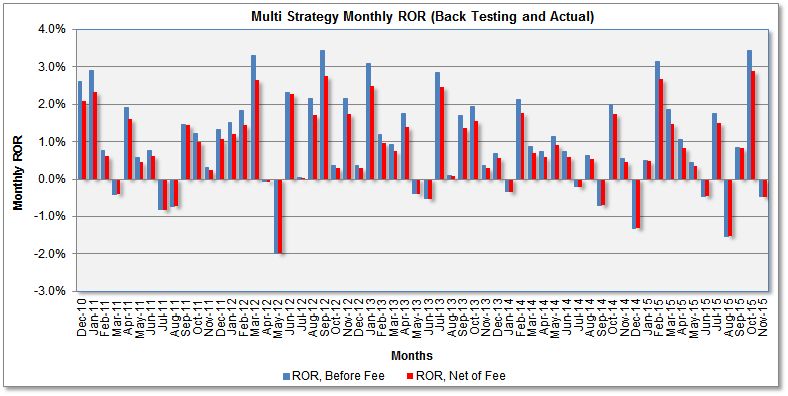
Fig. 2 - Combined Portfolio - Monthly RORs (14.29% each of the 7 strategies, 20% overleveraged)
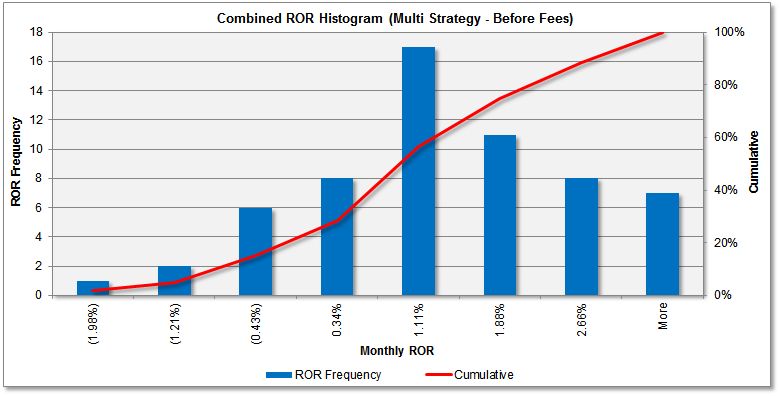
Fig. 3 - Combined Portfolio - Monthly ROR Distribution (14.29% each of the 7 strategies, 20% overleveraged)
III. PERFORMANCE STATISTICS (BACK TESTING RESULTS, 7 STRATEGIES, BEFORE PERFORMANCE FEES)
|
|
||||||||||||||||||||||||||||||||||||||||||||||||||||
Conclusion. Although individual/component trading programs have very good performance, combined trading further improves the risk-adjusted returns and maximizes the Sharpe Ratio.
Hypothetical Composite Performance Disclaimer
ONE OF THE LIMITATIONS OF A HYPOTHETICAL COMPOSITE PERFORMANCE RECORD IS THAT DECISIONS RELATING TO THE SELECTION OF TRADING ADVISORS AND THE ALLOCATION OF ASSETS AMONG THOSE TRADING ADVISORS WERE MADE WITH THE BENEFIT OF HINDSIGHT BASED UPON THE HISTORICAL RATES OF RETURN OF THE SELECTED TRADING ADVISORS. THEREFORE, COMPOSITE PERFORMANCE RECORDS INVARIABLY SHOW POSITIVE RATES OF RETURN. ANOTHER INHERENT LIMITATION ON THESE RESULTS IS THAT THE ALLOCATION DECISIONS REFLECTED IN THE PERFORMANCE RECORDS WERE NOT MADE UNDER ACTUAL MARKET CONDITIONS AND, THEREFORE, CANNOT COMPLETELY ACCOUNT FOR THE IMPACT OF FINANCIAL RISK IN ACTUAL TRADING. FURTHERMORE, THE COMPOSITE PERFORMANCE RECORD MAY BE DISTORTED BECAUSE THE ALLOCATION OF ASSETS CHANGES FROM TIME TO TIME AND THESE ADJUSTMENTS ARE NOT REFLECTED IN THE COMPOSITE.
Composite Performance Disclaimer
THIS COMPOSITE PERFORMANCE REPORT IS HYPOTHETICAL AND THESE TRADING ADVISORS HAVE NOT TRADED TOGETHER IN THE MANNER SHOWN IN THE COMPOSITE. HYPOTHETICAL PERFORMANCE RESULTS HAVE MANY INHERENT LIMITATIONS, SOME OF WHICH ARE DESCRIBED BELOW. NO REPRESENTATION IS BEING MADE THAT ANY MULTI-ADVISOR MANAGED ACCOUNT OR POOL WILL OR IS LIKELY TO ACHIEVE A COMPOSITE PERFORMANCE RECORD SIMILAR TO THAT SHOWN. IN FACT, THERE ARE FREQUENTLY SHARP DIFFERENCES BETWEEN A HYPOTHETICAL COMPOSITE PERFORMANCE RECORD AND THE ACTUAL RECORD SUBSEQUENTLY ACHIEVED.
To see actual trading results of this multi-strategy portfolio (which started live trading in December 2015), please visit the MS-Real page.