FX Quant > Actual Performance
The objective of FX Quant 11 - Currency Trading Program is to seek high absolute returns with low volatility and low correlation to the traditional equity and fixed income investments.
I. TRADING APPROACH
FX Quant 11 is a quantitative trading program based on time series analysis, statistical arbitrage and position size management. Through these methods, it trades currencies of developed countries (EUR, GBP, CHF, CAD, AUD, NZD, SEK, DKK, NOK and SGD) in the spot markets and does not trade futures or options on futures on any organized exchange. This program analyses exchange rates between the currencies comprising the basket. The strategy identifies relatively strong and weak currencies and gives specific trading signals for each currency, which are then implemented against the 10 remaining currencies. The resulting positions are then implemented in the market. It uses statistical methodology and not classical fundamental or technical analysis. There are no classical indicators which attempt to predict market direction (no one can predict market direction!), no pattern recognition techniques and no trading rules based on trader's experience. The trading system is always in the market, but portfolio components are adjusted daily - see these position size graphs. Leverage is applied in line with client's preferred risk tolerance level. Risk control is achieved through a variety of means which in most market conditions should minimize drawdowns. The first is portfolio construction and diversification; second is controlling leverage through position sizing adjusted according to account size, volatility and risk-reward analysis; and third is stops based on money management rules. You can read here about the trading system developer.
Beginning November 2008 on this page we will be tracking the actual performance of the FX Quant 11 trading program. To see extrapolation into the past of the currently traded strategy (ver. 12/2012), see the hypothetical performance report from back testing on the FX Quant 11 page. Actual trading results from November 2008 to December 2012 were achieved trading two older versions of FX Quant 11. You can also download this 2-page Trading Program Fact Sheet.
II. PERFORMANCE SUMMARY
PAST PERFORMANCE IS NOT NECESSARILY INDICATIVE OF FUTURE RESULTS. THE RISK OF LOSS IN TRADING FOREX CAN BE SUBSTANTIAL. YOU SHOULD THEREFORE CAREFULLY CONSIDER WHETHER SUCH TRADING IS SUITABLE FOR YOU IN LIGHT OF YOUR FINANCIAL CONDITION AND INVESTMENT OBJECTIVES.
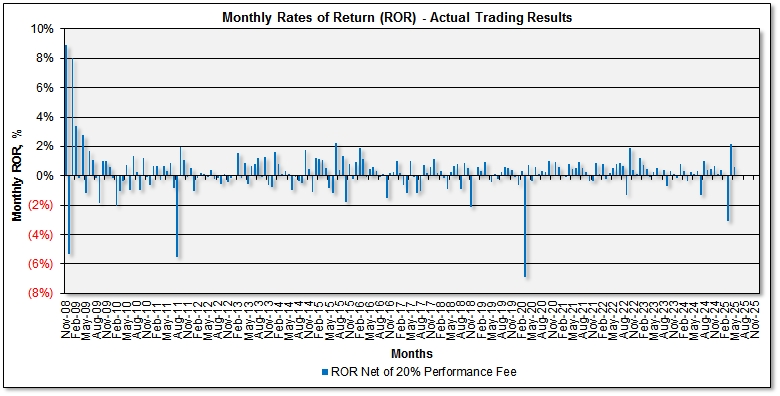
1. Monthly Rates of Return (ROR), Before/After Performance Fees
|
|
Jan |
Feb |
Mar |
Apr |
May |
Jun |
Jul |
Aug |
Sep |
Oct |
Nov |
Dec |
YTD |
VAMI |
|
2008 |
See back testing results of the currently traded strategy (v.12/2012) | 8.91% | (4.62%) (5.33%)* |
3.88% 3.10%* |
1,038.8 1,031.0* |
|||||||||
|
2009 |
8.00% | 3.42% | 2.44% (0.14%)* | 2.75% | (1.18%) | 2.49% 1.69%* | 1.11% | (0.18%) | (1.88%) (1.88%)* | 1.01% | 0.98% | 1.01% 0.61%* | 21.48% 17.03%* | 1,261.9 1,206.6* |
|
2010 |
(0.16%) | (2.05%) | (1.05%) (1.05%)* | (0.35%) | 0.73% | (0.97%) (0.97%)* | 1.37% | 0.23% | (0.99%) (0.99%)* | 1.22% | (0.02%) | (0.62%) (0.62%)* | (2.68%) (2.68%)* | 1,228.1 1,174.3* |
| 2011 | 0.64% | 0.67% | (0.31%) (0.31%)* | 0.70% | 0.35% | 0.92% 0.87%* | (0.86%) | (5.53%) | 1.98% 1.98%* | 1.05% | (0.09%) | 0.53% 0.53%* | (0.15%) (0.20%)* | 1,226.3 1,172.0* |
| 2012 | (1.04%) | (0.15%) | 0.21% 0.21%* | 0.10% | (0.03%) | 0.41% 0.41%* | (0.22%) | (0.16%) | (0.58%) (0.58%)* | 0.11% 0.11%* | (0.45%) | (0.18%) (0.18%)* | (1.98%) (1.98%)* | 1,202.0 1,148.8* |
| 2013 | 0.06% | 1.56% | (0.17%) (0.17%)* | 0.87% | (0.58%) | 0.63% 0.63%* | 0.83% | 1.20% | (0.05%) (0.05%)* | 1.28% | (0.60%) | (0.76%) (0.76%)* | 4.31% 4.31%* | 1,253.8 1,198.2 |
| 2014 | 1.72% 1.65%* | 0.96% 0.77%* | 0.18% 0.14%* | 0.43% 0.35%* | 0.18% 0.15%* | (1.00%) (1.00%)* | (0.06%) (0.06%)* | (0.34%) (0.34%)* | (0.51%) (0.51%)* | 1.74% 1.74%* | 0.51% 0.44%* | (1.22%) (1.22%)* | 2.67% 2.18%* | 1,287.3 1,224.3* |
| 2015 | 1.21% 1.19%* | 1.46% 1.17%* | 1.33% 1.06%* | 0.69% 0.55%* | (0.85%) (0.85%)* | (1.19%) (1.19%)* | 2.31% 2.26%* | 0.48% 0.39%* | 1.71% 1.37%* | (1.76%) (1.76%)* | 0.79% 0.79%* | (0.24%) (0.24%)* | 6.01% 4.76%* | 1,364.6 1,282.7* |
| 2016 | 0.97% 0.97%* | 2.31% 1.90%* | 1.42% 1.13%* | (0.02%) (0.02%)* | 0.53% 0.43%* | 0.74% 0.59%* | 0.44% 0.35%* | (0.04%) (0.04%)* | 0.10% 0.09%* | (1.48%) (1.48%)* | 0.22% 0.22%* | 0.27% 0.27%* | 5.53% 4.45%* | 1,440.0 1,339.7* |
| 2017 | 1.04% 1.04%* | 0.24% 0.20%* | (0.59%) (0.59%)* | (1.17%) (1.17%)* | 0.99% 0.99%* | (0.06%) (0.06%)* | (1.14%) (1.14%)* | (1.02%) (1.02%)* | 0.74% 0.74%* | 0.19% 0.19%* | 0.60% 0.60%* | 1.15% 1.15%* | 0.92% 0.87%* | 1,453.2 1,351.3* |
| 2018 | 0.19% 0.19%* | 0.36% 0.33%* | (0.14%) (0.14%)* | (0.92%) (0.92%)* | 0.23% 0.23%* | 0.65% 0.65%* | 0.94% 0.79%* | (0.90%) (0.90%)* | 0.86% 0.86%* | 0.69% 0.56%* | (2.14%) (2.14%)* | 0.01% 0.01%* | (0.21%) (0.53%)* | 1,450.1 1,344.2* |
| 2019 | 0.57% 0.57%* | 0.31% 0.31%* | 0.91% 0.91%* | 0.07% 0.07%* | (0.40%) (0.40%)* | 0.10% 0.10%* | (0.21%) (0.21%)* | 0.24% 0.24% | 0.61% 0.60%* | 0.65% 0.52%* | 0.53% 0.43%* | (0.08%) (0.08%)* | 3.34% 3.09%* | 1,498.5 1,385.7* |
| 2020 | (0.65%) (0.65%)* | 0.35% 0.35%* | (6.91%) (6.91%)* | 0.71% 0.71%* | (0.33%) (0.33%)* | 0.58% 0.58%* | 0.10% 0.10%* | 0.30% 0.30%* | 0.25% 0.25%* | 1.00% 1.00%* | 0.03% 0.03%* | 0.94% 0.94%* | (3.85%) (3.85%)* | 1,427.5 1,320.0* |
| 2021 | 0.62% 0.62%* | 0.02% 0.02%* | (0.12%) (0.12%)* | 0.79% 0.79%* | 0.49% 0.49%* | 0.54% 0.54%* | 0.91% 0.91%* | 0.53% 0.53%* | 0.30% 0.29%* | (0.33%) (0.33%)* | (0.39%) (0.39%)* | 0.88% 0.85% | 4.31% 4.26%* | 1,502.9 1,389.2* |
| 2022 | 0.11% 0.09%* | 0.97% 0.78%* | (0.21%) (0.21%)* | 0.19% 0.19%* | 0.62% 0.50%* | 0.96% 0.77%* | 1.05% 0.84%* | 0.83% 0.66%* | (1.31%) (1.31%)* | 2.04% 1.89%* | 0.49% 0.39%* | 0.18% 0.14%* | 6.04% 4.80%* | 1,593.6 1,455.9* |
| 2023 | 1.51% 1.21%* | 0.92% 0.73%* | 0.54% 0.43%* | (0.11%) (0.11%)* | 0.27% 0.24%* | 0.64% 0.51%* | 0.06% 0.05%* | 0.50% 0.40%* | (0.72%) (0.72%)* | 0.35% 0.35%* | 0.15% 0.15%* | (0.16%) (0.16%)* | 3.99% 3.11%* | 1,657.3 1,501.2* |
| 2024 | 0.92% 0.81% | 0.39% 0.31%* | (0.39%) (0.39%)* | 0.26% 0.26%* | 0.11% 0.11%* | 0.41% 0.33%* | (1.32%) (1.32%)* | 0.99% 0.99%* | 0.40% 0.39%* | 0.60% 0.48%* | 0.80% 0.64%* | 3.18% 2.62%* | 1,710.0 1,540.4* | |
* - Net of 20% performance fee. Before 2014, performance fees were calculated quarterly. Beginning January 2014, performance fees are calculated monthly
- former version of the strategy (replaced by ver.12/2012 in January 2013)
The above table shows actual trading results, before and after performance fees. Rates of return (ROR), net of 20% performance fee, are marked by asterisk (*). ROR figures have been calculated according to CFTC Regulation 4.35(a)(6)(i)(F), by dividing the monthly net performance (gain or loss) by the nominal (notional) account size. See also this performance fee calculation example in Excel.
The charts below show monthly rates of return (ROR) and the growth of $1,000 (the Value Added Monthly Index - VAMI), before and after 20% performance/incentive fee deduction. Compounding by monthly profit reinvesting is used.


(Daily returns are calculated from the single largest managed account. Monthly returns are AUM weighted from all accounts traded)
III. Performance Analytics (Based on Actual Trading Results, Net of 20% Performance Fee)
|
|
||||||||||||||||||||||||||||||||||||||||||||||||||||
Value at Risk (VaR) and Drawdown Analysis, based on strategy back testing, can be found on the FX Quant 11 back testing page.
Compounding is an efficient method for increasing your account equity exponentially, by reinvesting the profit (see the VAMI chart above). Since FX Quant 11 trades in small increments, it is one of the few trading programs suitable for monthly compounding. You can see these formulas for ROR calculations and compounding. Try this Financial Calculator to see how profit reinvesting (compounding) works.
Risk Disclaimer
THE RISK OF LOSS IN TRADING FOREIGN EXCHANGE (FOREX) CAN BE SUBSTANTIAL. YOU SHOULD THEREFORE CAREFULLY CONSIDER WHETHER SUCH TRADING IS SUITABLE FOR YOU IN LIGHT OF YOUR FINANCIAL CONDITION AND INVESTMENT OBJECTIVES. PAST PERFORMANCE IS NOT NECESSARILY INDICATIVE OF FUTURE RESULTS. THE PERFORMANCE QUOTED REPRESENTS PAST PERFORMANCE AND CURRENT PERFORMANCE MAY BE LOWER OR HIGHER. TRADING IN FOREIGN EXCHANGE IS SPECULATIVE AND MAY INVOLVE THE LOSS OF PRINCIPAL; THEREFORE, FUNDS PLACED UNDER MANAGEMENT SHOULD BE RISK CAPITAL FUNDS THAT IF LOST WILL NOT SIGNIFICANTLY AFFECT ONE'S PERSONAL WELL BEING. THIS IS NOT A SOLICITATION TO INVEST AND YOU SHOULD CAREFULLY CONSIDER YOUR FINANCIAL SITUATION PRIOR TO MAKING ANY INVESTMENT OR ENTERING INTO ANY TRANSACTION. PLEASE SEE THE COMPLETE DISCLOSURE DOCUMENT.
![]() BACK TO THE MAIN PERFORMANCE PAGE
BACK TO THE MAIN PERFORMANCE PAGE