Below are given
back testing results of FX Quant 11 (ver. 12/2012), generated by our
software. These results should be considered as extrapolation into the past of
FX Quant 11 - Currency Trading Program, which started live trading on January 2, 2013. It replaced
the older versions of the strategy, which have
been trading since November 1, 2008. Performance fees (20% of
new net profit above high water mark) are not deducted from back testing results.
To see actual trading results, please go to the FXQ
/ Real Performance page.
FX Quant 11 features:
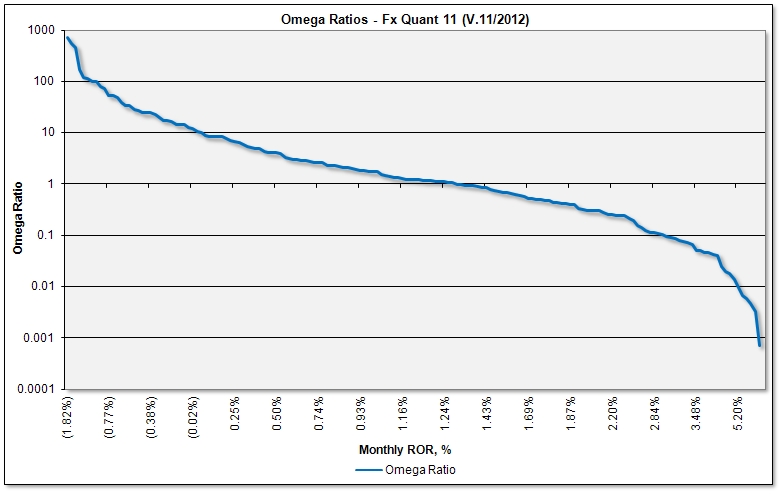
- The variability of returns is low and the
Sharpe, Sortino, Calmar and Omega Ratios are excellent - among the highest in
the currency trading industry. The strategy is extremely robust i.e. insensitive
to parameter changes (it is not a curve fitted, or over optimized system), which usually promises excellent
performance in forward trading, after the back testing period.
- Transaction costs are very low (2.45% of net
asset value per annum), relative to average annualized rate of return (27.9% per
annum). Since bid/ask spread costs are around 10% of theoretical return, actual
rates of return are 90% of theoretical returns.
- There is no
upper limit on the account size. By trading more frequently (for example,
1/3 of account traded each 8 hours) the strategy can trade accounts of virtually
any size without performance degradation (it would be even improved, due to
time-factor diversification)
- The strategy is not affected by price
slippage (it trades in small increments, by market orders, only once a day). Hence, the actual trading results are very close to hypothetical
results. See "Transaction costs" above.
Average number of R/T transactions
(100k FX lots) per $1Million NAV per year
980
Average annual transaction
costs - bid/ask spreads (deduct from annual ROR)
2.45% of NAV
per annum
Average transaction bid/ask spread, as a fraction
of the transaction value
0.00025
* -
Total long/short position value is roughly 2 × strategy leverage. It is used
for portfolio turnover and costs calculations. Leverage (long only position
value) is used as a measure
of exposure.
To see more backtesting results,download this Excel table(Fx Quant
11 - V.11/2012). Explore all Excel worksheets (click the tabs at the bottom) and scroll down all
worksheets to see graphs and performance analytics. You can also download daily rates of returnfrom backtesting
(Excel, 1 MB), with 5 day VaR calculations and 5-day ROR histograms.
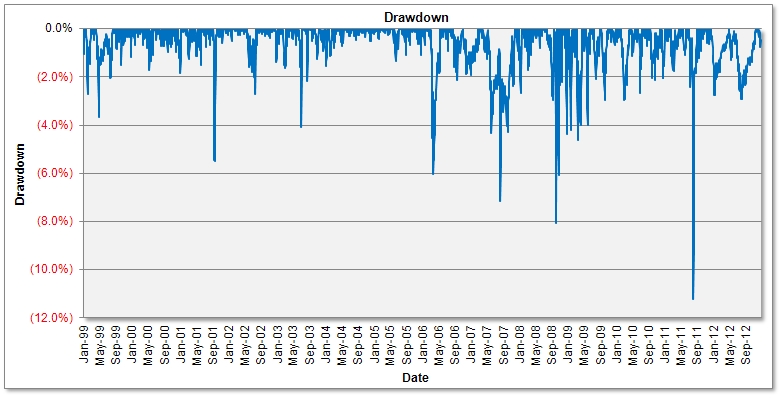
PLEASE ANALYZE AND
THOROUGHLY UNDERSTAND THE RISK / DRAWDOWN PARAMETERS ABOVE AND THE DRAWDOWN
CHART BELOW BEFORE YOU DECIDE TO INVEST IN THE PROGRAM. AS WITH ANY TRADING
PROGRAM, THERE IS NO GUARANTEE THE SYSTEM WILL NOT EXCEED THE WORST DRAWDOWN
FROM THE PAST. WE DO NOT RECOMMEND INVESTING MORE THAN 1/3 OF YOUR TOTAL
INVESTMENT PORTFOLIO IN ANY PARTICULAR PROGRAM, INCLUDING QT - CURRENCY
TRADING PROGRAM.
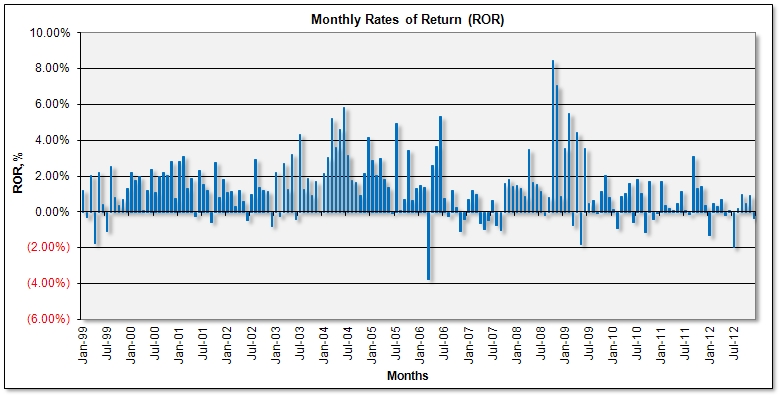
3. Performance Graphs and Histograms
3.1 Monthly Graphs
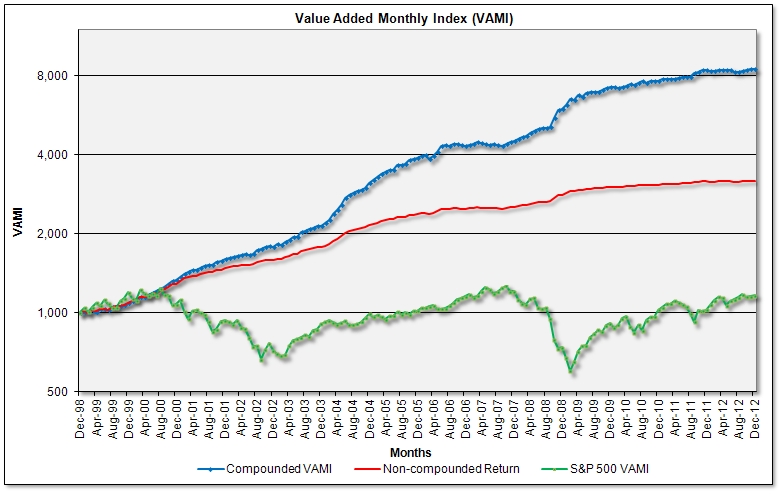
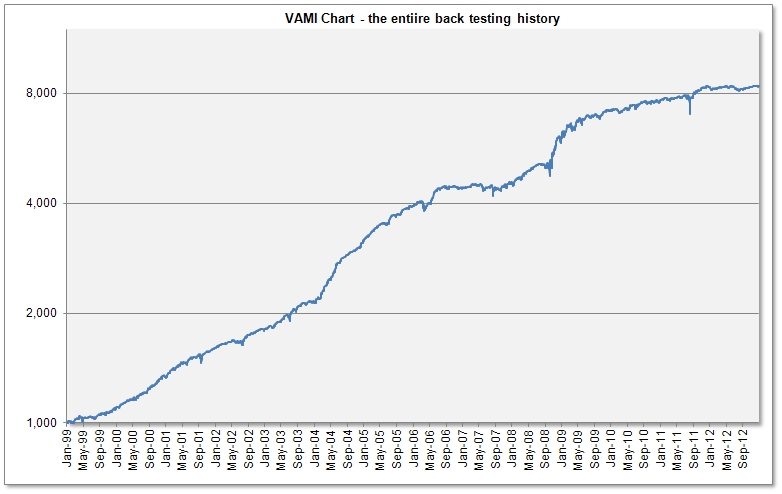
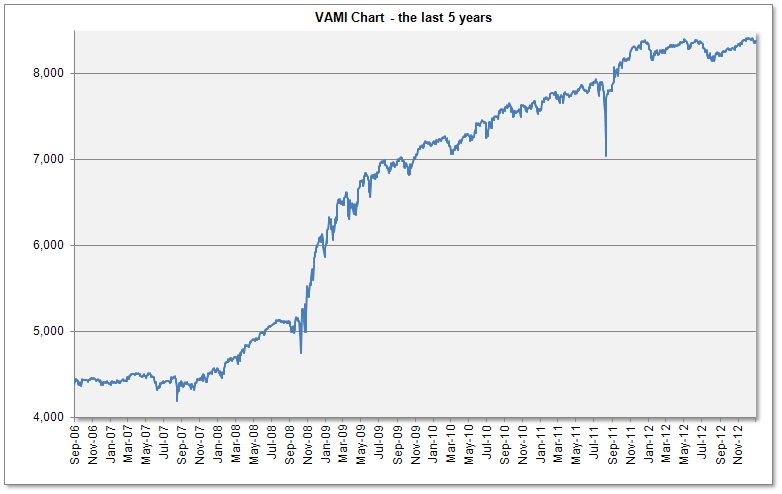
Note the semi-logarithmic co-ordinates in the
VAMI chart
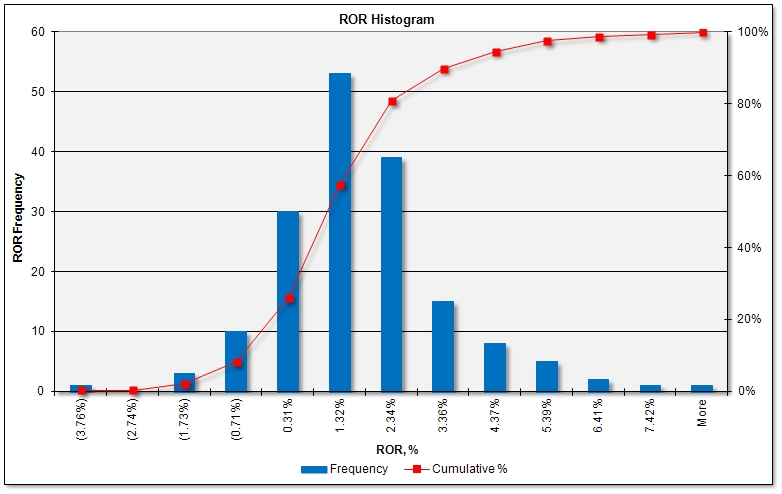
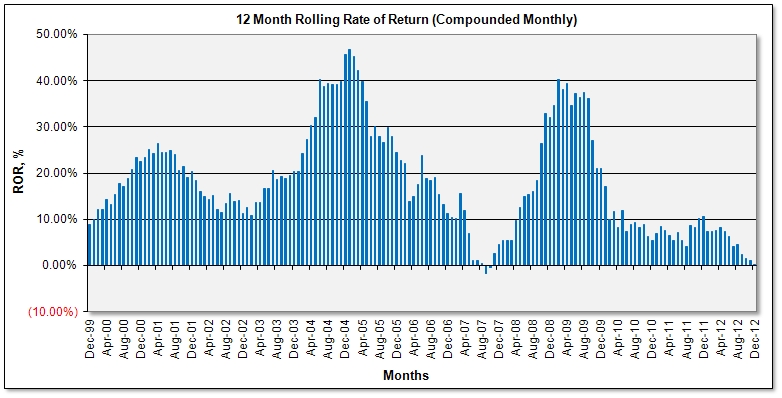
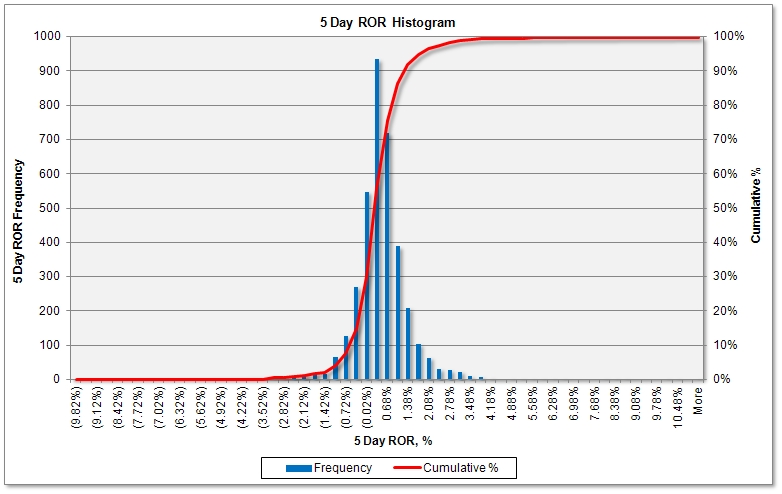
1. There is very regular,
bell-shaped, thin tailed distribution of 5-day rolling rates of return . Robust systems, which are not curve-fitted usually have
this type of distribution.
2. The 5-day rolling rate of
return (ROR) mean is positive and equals 0.299%. There is a 50%
probability that the 5-day rate of return will be greater than 0.299% and 50%
probability the return will be less than 0.299%.
3. 5-Day RORs are more clustered
in the positive territory in the histogram above. There is a 31.4% probability that a 5-day ROR will be
negative and a 68.6% probability the 5-day ROR will be positive.
4. The 5-day
Value-at-Risk (VaR)
for the 95% confidence level is 0.94%. This means that the risk of loss in a
5-day period is 0.94%, with a 95% probability. The probability of loss of more
than 0.94% in a 5 day period is 5%. Similarly, the 5-day VaR for the 99%
confidence level is 2.30%. Excessive negative RORs do and will happen, although
with decreasing probability. To see these calculations open the 5 Day ROR
Percentile tab in this
Excel workbook.
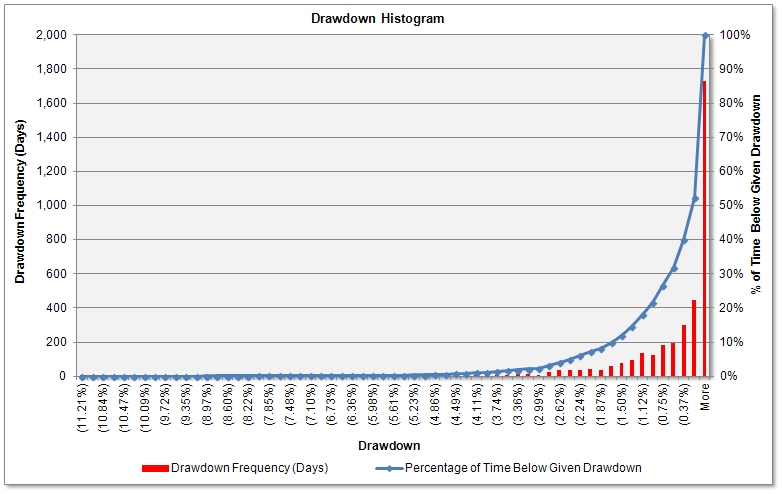
1.) how many days the system was in drawdown of
given magnitude (the red colored line).
The back testing period is 3638 days;
2.) what time (as a percentage of the total back testing time) the system
spent below a given drawdown level (the blue
colored line). For example, the system spent only 5% of time (182 out of
3638 days) in drawdown worse than
2.43%, and only 1% (36 out of 3638 days) in drawdown worse than 4.11%. These
figures also give some idea on the recovery time. Calculations can be found
in this Excel worksheet
(1.1 MB),
under the Drawdown Histogram tab.
The most important facts to remember from the
Drawdown Histogram are that:
1.) large drawdowns are relatively rare
(the larger the drawdown - the less the probability, although it does exist - see the
11.21% drawdown far left in the histogram above);
2.) the system
quickly recovers from extremely large drawdowns. There is no answer,
however,
how deep the drawdown can go; statistics only show it should not last for too long. This chart also shows
how important it is to be patient and not to quit trading during drawdown
(which is the worst possible moment to do so).
Compounding
(see the VAMI chart above)is an efficient method for increasing your account
equity exponentially, by reinvesting the profit
- try this
Financial Calculator.
Since FX Quant 11 trades in small increments, it is one of the few trading
programs suitable for monthly compounding. You can see these
formulas for ROR
calculations and compounding.
The above
tables and charts document FX Quant 11's historical hypothetical performance
based on back testing results. To see actual trading results, go to the
FXQ Real
Performance page (after January 1 , 2013).
Please note
that performance results reported are before performance fees, which
decrease returns. Interest on open positions is not taken into account in
hypothetical results. There are also slight differences in profit/loss at
different platforms, due to
different methods for profit/loss calculation (mark-to-market vs. closed
trade profit/loss).
Better
results (smaller drawdown and better Sharpe and Sortino Ratio) can be
obtained by trading multiple trading strategies. The three currency trading
programs (FX Quant 11, FX Index Arb and FX Basket Quant) can be further
combined with our volatility
trading programs -
see this 6-strategy composite
back testing report.
HYPOTHETICAL OR
SIMULATED PERFORMANCE RESULTS HAVE CERTAIN INHERENT LIMITATIONS. UNLIKE AN
ACTUAL PERFORMANCE RECORD, SIMULATED RESULTS DO NOT REPRESENT ACTUAL TRADING.
ALSO, SINCE THE TRADES HAVE NOT ACTUALLY BEEN EXECUTED, THE RESULTS MAY HAVE
UNDER-OR-OVERCOMPENSATED FOR THE IMPACT, IF ANY, OF CERTAIN MARKET FACTORS, SUCH
AS LACK OF LIQUIDITY. SIMULATED TRADING PLATFORMS IN GENERAL ARE ALSO SUBJECT TO
THE FACT THAT THEY ARE DESIGNED WITH THE BENEFIT OF HINDSIGHT. NO REPRESENTATION
IS BEING MADE THAT ANY ACCOUNT WILL OR IS LIKELY TO ACHIEVE PROFITS OR LOSSES
SIMILAR TO THOSE SHOWN.
Risk Disclaimer
THE RISK OF
LOSS IN TRADING COMMODITIES CAN BE SUBSTANTIAL. YOU SHOULD THEREFORE CAREFULLY
CONSIDER WHETHER SUCH TRADING IS SUITABLE FOR YOU IN LIGHT OF YOUR FINANCIAL
CONDITION AND INVESTMENT OBJECTIVES. PAST PERFORMANCE IS NOT NECESSARILY
INDICATIVE OF FUTURE RESULTS. THE PERFORMANCE QUOTED REPRESENTS PAST PERFORMANCE
AND CURRENT PERFORMANCE MAY BE LOWER OR HIGHER. TRADING IN FOREIGN EXCHANGE IS
SPECULATIVE AND MAY INVOLVE THE LOSS OF PRINCIPAL; THEREFORE, FUNDS PLACED UNDER
MANAGEMENT SHOULD BE RISK CAPITAL FUNDS THAT IF LOST WILL NOT SIGNIFICANTLY
AFFECT ONE'S PERSONAL WELL BEING. THIS IS NOT A SOLICITATION TO INVEST AND YOU
SHOULD CAREFULLY CONSIDER YOUR FINANCIAL SITUATION PRIOR TO MAKING ANY
INVESTMENT OR ENTERING INTO ANY TRANSACTION. PLEASE SEE THE COMPLETE
RISK DISCLOSURE.